
株やFX、仮想通貨において大きな大局のなかの転換点を捕らえ、ロングポジションを保有し、大きな値幅が取れると、ほぼ90%以上の確率で安定して勝てるようになり、トータルプラスになり、専業プロトレーダーとして生きていけるようになります。しかしここで生まれる疑問はどうやってトレンドの転換点がわかるのか、という点です。今回の記事では下降トレンドから上昇トレンドに転換するときに現れる特徴を紹介しています。この傾向が表れると60-70%の確率でトレンドは転換します。トレンド転換は日足か週足で見るようにしてください。上昇から下落トレンドの場合は下記記事を参考にしてください。

下降トレンド
相場が常に売られ続け、下降していくときというのはいきなり大きく下に動きます。その後買い戻しが何度も、何時間も入り続けるのですが、また大きな下落が来るという流れです。しかしある時大きな下落の後に下落しなくなるのです。それが転換の兆しになります。
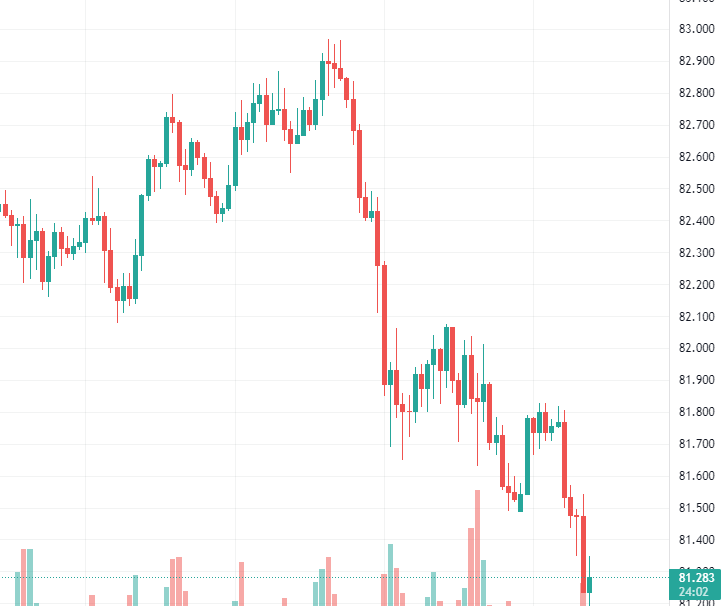
パターン1 : 大きく下げたあと強い買い戻し
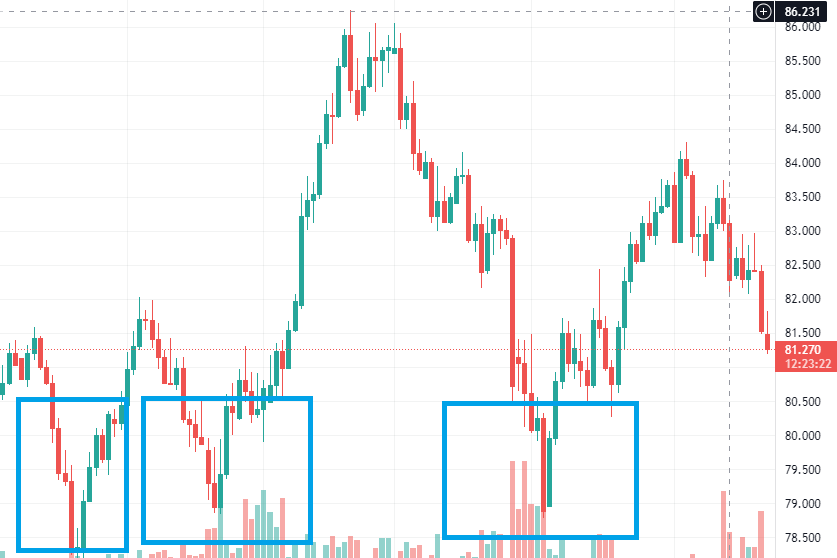
下落からの上昇の場合は、大きく落としてから強い買い反発が起こります。下記のチャートは2022年1月のADU/JPY日足です。ポイントは2つあります。1つ目は青色の枠を参照してほしいのですが、前回、前々回最安値付近で転換、もしくは激しく買いと売りで揉めていた価格帯で転換することが多いです。2つ目は大きく下へ落としてくるのですが、そのあと大きな買い戻しがきます。これがどの通貨ペアでも共通してみることができる傾向です。
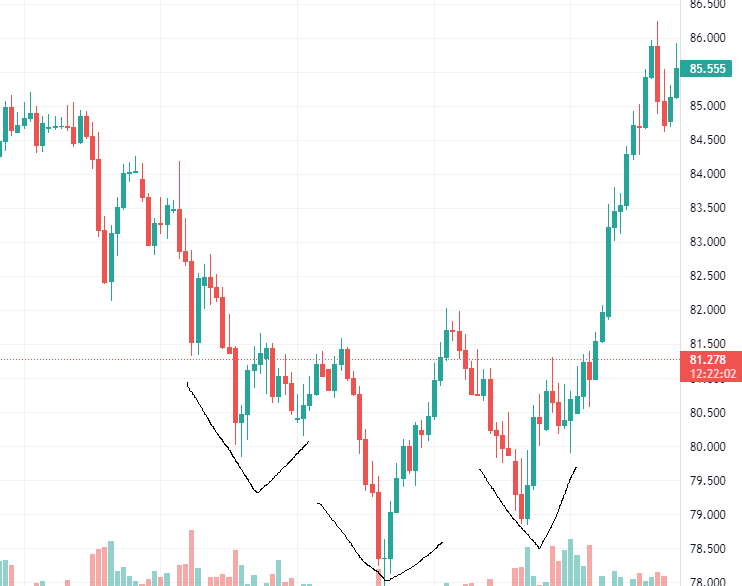
パターン2 : 逆ヘッドアンドショルダー
下記のチャートは2021年のADU/JPY日足です。 逆ヘッドアンドショルダーと呼ばれる形状になっています。この形ができると高い確率で上がります。2つの山と3つの谷で形成され3つの谷に挟まれた真ん中の谷が一番低い谷になります。この形状ができるときは最後の右肩にあたる右の谷が上がるタイミングでエントリーするのが最も適切です。直近の最安値を更新したら損切りしてください。
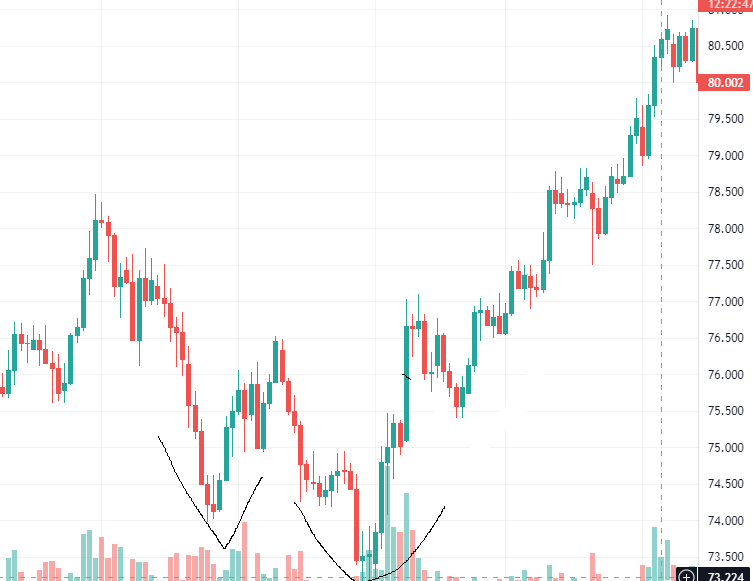
パターン3 : 逆ダブルトップ
下記のチャートは2021年10月のADU/JPY日足です。逆ダブルトップと呼ばれる現象で、2つの大きな谷が形成されます。2回大きく下落しており大きな谷が起こってから上昇をしています。だいたい2つ目の右の谷が上がっていくポイントがエントリーポイントです。 直近の最安値を更新したら損切りしてください。
上昇する場合
もし上昇する場合は買い圧が入りますが、一気に上がることはありません。徐々に上がっていくので本当に転換したかどうかわかるのは1日以上時間が必要です。売りは一気に下げるのですが、買いの場合は突然一気に上がることがありません。そのため本当に転換したかがわかるには時間が必要なのです。
まとめ
以上の3つのシグナルはトレンドが転換するサインになりやすいので参考にしてください。もしこの流れを掴めば大きな値幅が取れるのがメリットです。しかしもし逆行する場合はかならず直近最安値を超えた時点で損切りするようにしてください。直近最安値を更新した場合はトレンド転換せず、下降トレンドが継続される可能性が極めて高いです。また、この傾向はFXだけでなく、仮想通貨や株でも見られます。どのトレードでも応用が利きます。


コメント