株やFX、仮想通貨において大きな大局のなかの転換点を捕らえ、ロングポジションを保有し、大きな値幅が取れると、ほぼ90%以上の確率で安定して勝てるようになり、トータルプラスになり、専業プロトレーダーとして生きていけるようになります。しかしここで生まれる疑問はどうやってトレンドの転換点がわかるのか、という点です。今回の記事では上昇トレンドから下降トレンドに転換するときに現れる特徴を紹介しています。この傾向が表れると60-70%の確率でトレンドは転換します。できれば日足か週足で見るようにしてください。

上昇トレンド
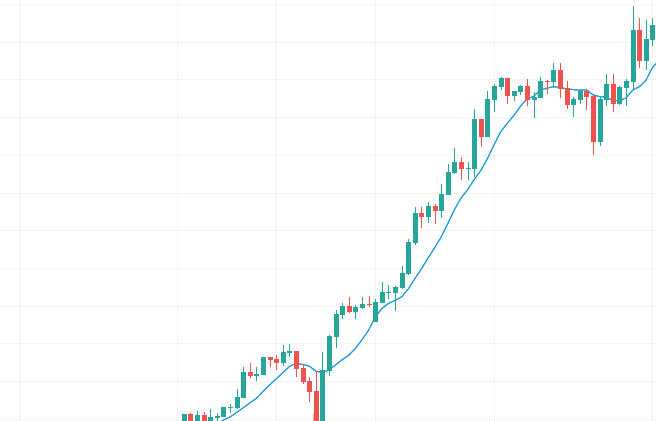
相場が常に買われ続け、上昇していくときというのはいきなり大きく上に動くことは稀です。むしろ徐々にじわじわと上がっていき、売りが入ってもほとんど落とさない状況が続きます。しかしあるときに、買いが止まるタイミングが起こると、チャートに一定の傾向が見えるようになるのです。
パターン1 : 大きく上げたあと同じ価格帯を上下する
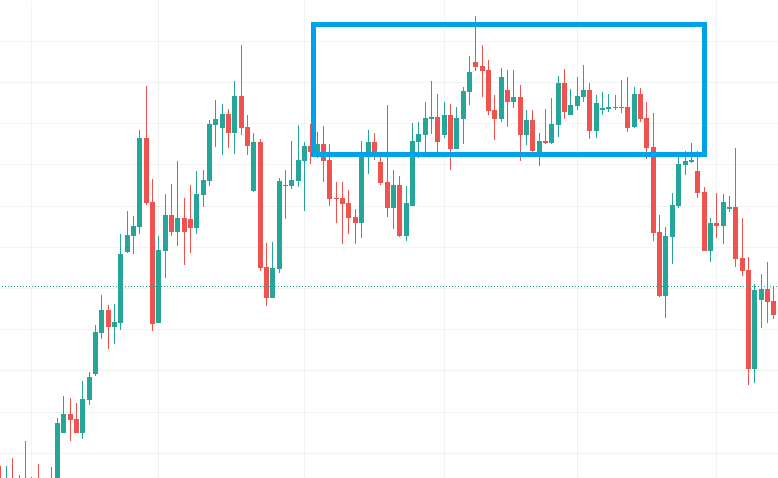
上記の図は2021年3月~6月ごろのAUD/JPYの日足です。2月までは一方的にAUDが買われ続けていたのですが、上げ疲れたのか、青色枠のチャートのように同じ価格帯を上下に動き始めます。そして最高値を更新できなくなり、上下をさまよい始めると、大暴落を起こす可能性が高いです。このようなチャート形状になったときは高値圏でポジションを持っておいて下げるまで待つことを推奨します。直近の高値を更新したら損切りしてください。またトレンドの終盤は買いと売りが激しく入れ替わることが多いです。
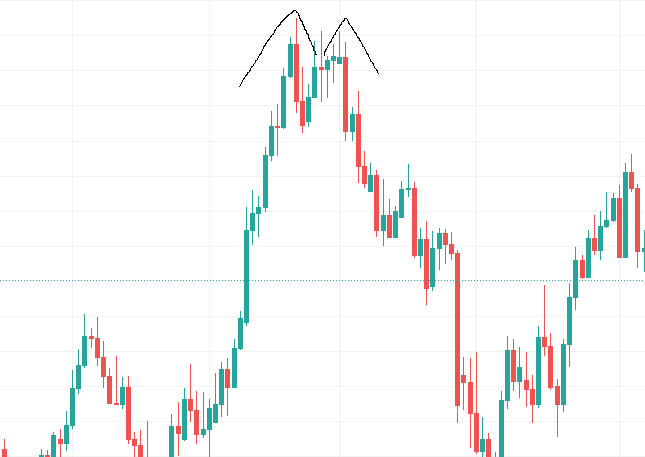
パターン2 : ヘッドアンドショルダー
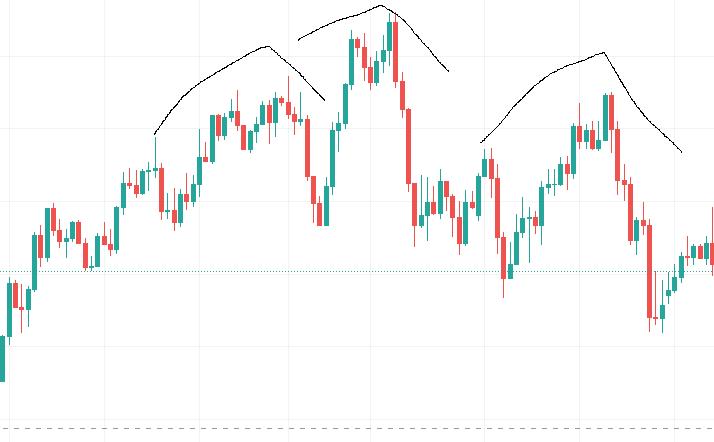
上記の図は2022年1月の4時間足です。ヘッドアンドショルダーと呼ばれる形状になっています。この形ができると高い確率で落とす可能性が高いです。三つの山と二つの谷で形成され二つの山に挟まれた真ん中の山が一番高い山になります。この形状ができるときは最後の右肩にあたる右の山が落ちるタイミングでエントリーするのが最も適切です。直近の高値を更新したら損切りしてください。
パターン3 : ダブルトップ
上記の図は2021年11月の日足です。 ダブルトップと呼ばれる現象で、2つの大きな山が形成されます。だいたい2つ目の右の山が1つ目の大きな山を越えられず、落としていくのでそのタイミングがエントリーポイントです。 直近の高値を更新したら損切りしてください。
下落する場合
もし下落する場合は強い売り圧が入ります。100pips近くは簡単に落とすのが特徴です。買いのときと違い、売りの場合は一気に大きく落とすのが特徴です。そのため、嵌った場合は面白いように落ちるはずです。
まとめ
以上の3つのシグナルはトレンドが転換するサインになりやすいので参考にしてください。もしこの流れを掴めば大きな値幅が取れるのがメリットです。しかしもし逆行する場合はかならず直近最高値を超えた時点で損切りするようにしてください。直近最高値を更新した場合はトレンド転換せず、上昇トレンドが継続される可能性が極めて高いです。また、下降トレンドから上昇トレンドに転換する際はまた、別の特徴があるのでまた別途紹介したいと思います。また、この傾向はFXだけでなく、仮想通貨や株でも見られます。どのトレードでも応用が利きます。


コメント