
今回は株トレーダー、FXトレーダー、仮想通貨トレーダーすべてに共通する話です。どのトレードでも大きな大局での転換があるときは、上か下かがわからなくなります。買いと売りのパワーバランスが均等になることで激しい上下のアップダウンが起こるのです。今回は日足を使って、トレンド転換するときのチャートの形を紹介していきます。そしてどのようなときにトレンド転換が起きやすいのかも併せて追記します。
買いと売りのパワーバランスが等しい
下記チャートはGBP/JPYの日足2022年2月現在のチャートです。注目するべき点は青い枠で囲ったところ。目次の通り、トレンド転換をするときというのは買いと売りのパワーバランスが同等になることから、激しい上下動をすることが特徴です。ある日は買い、次の日は売り、しかしその次の日は買いとなることで、トレーダーからするとどっちへ行ったらいいのかわからなくなります。しかしこのタイミングがまさにトレンド転換の予兆なのです。
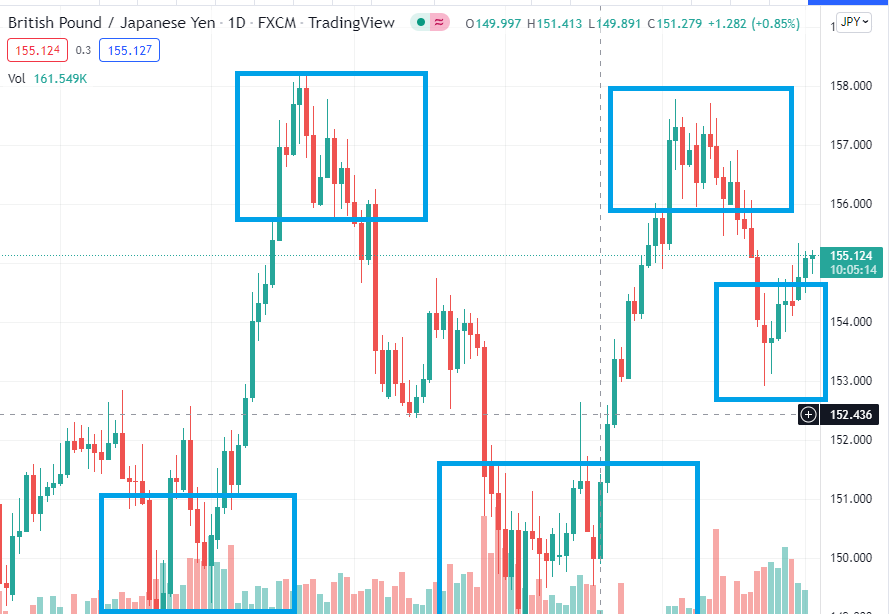
日足を見ればとても分かりやすいのですが特徴としては下記の点が上げられます。
- 日が変わるごとに上と下が交互に行き交う。
- 同じ価格帯で上下動が激しくなる。
- 上か下か大局の方向性が分からなくなる。
大きく売り(買い)が入った後、大きな全戻しがある
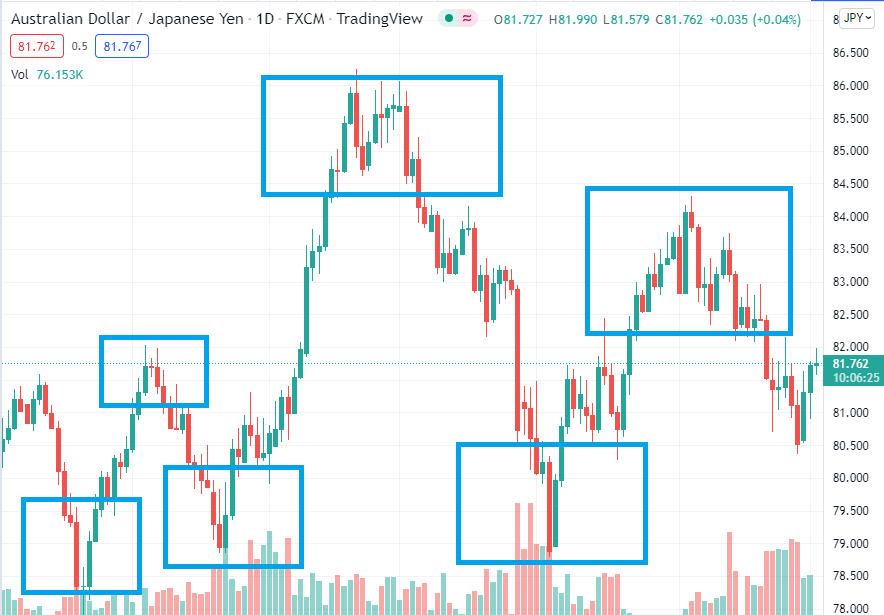
下記チャートはAUD/JPYの日足2022年2月現在のチャートです。注目するべき点は青い枠で囲ったところ。目次の通り、トレンド転換をするときの特徴のひとつとして大きな売り(買い)が入った後に全戻しかそれ以上の売りか買いが入ることです。特に売りから買いへの転換時はこの傾向がよく出ます。買いから売りの場合は揉めて上下動を何回も繰り返します。
トレンド転換に付いていかないと大損の可能性
トレンド転換のタイミングはあるときやってきますが、それを正確に察知できる人はそうそういません。大事なのは目線の切り替えをいかに早くできるかでしょう。上昇トレンドなのに強い売りが2回も3回も入ってきたときはまさにトレンド転換のサインだと思ったほうが良いです。頑なに同じ方向性で戦い続けると大損をしてしまい、取返しのつかないことになりかねません。そのため、素早い切り替えがトレーダーには求められます。方向性が分からなくなった場合はいっそトレードをしないという選択肢もありです。トレードでトータルプラスを出し続けるにはいかに傷口を浅くできるかにかかっています。

参照記事
トレンド転換の信号は上記の点と下記の記事も併せて読むと掴みやすくなります。トレードで一番大事なのは大きな流れに絶対逆らわないことです。大局と違う流れが起こってもそれは一時的なもので最終的には必ず週足か日足の方向性へ収束していくということを知っておきましょう。


コメント