株でも、FXでも、仮想通貨でもトレードをしているなかで、含み益になっているときにどこで利食いをしたらいいか悩むことはありませんか。また、含み損になったときにどこで損切りしたらいいか悩むことはありませんか。この記事ではトレードで決済をするタイミングはどこなのかを書いています。絶対こうしなければならない、ということではありませんが目安の一つとして考えてほしいのです。GBP/JPYを参考にして話をしていきます。ちなみにこの考え方はトレードと呼ばれるものすべてに応用が利くものです。また、短期トレード、長期トレードどちらでも応用が利きます。
ポイント1 : 前回最高値、もしくは前回最安値
利食いもしくは損切りポイントの目安として前回最高値、前回最安値を目安に反転することがあります。下記チャートの赤い枠をご覧ください。GBP/JPYの日足、2022年1月のチャートです。最高値が158円で2021年10月に達したポイントです。その後、一度暴落するものの、2021年12月に再高騰。157.7円まで達しました。しかし2022年に入ってから反転し下落が始まっています。ちょうど前回最高値付近を目安に反転したいい例です。
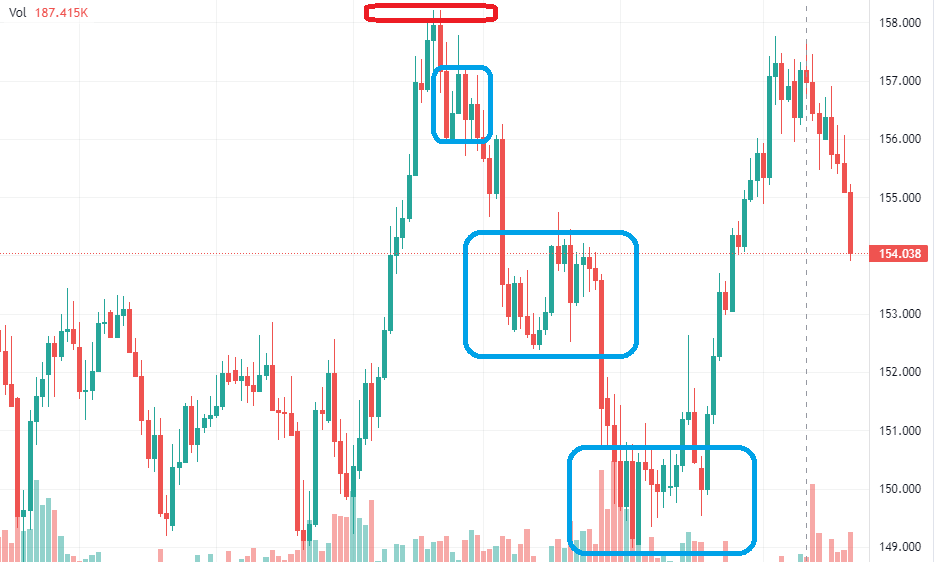
・ここで上の図のチャートを例にすると、直近最高値は158円、直近最安値は149円になります。買いの場合は158円付近、売りの場合は149円付近で決済するというのが一つの目安になります。
・逆に言えば158円付近で売りエントリー、149円付近で買いエントリーをいれれば嵌ると大きな利益を得られる可能性があります。
・買いを150円のときに入れた場合、上記チャートは直近158円、157.7円まで上がったため158円あたりで利食い。逆行した場合は直近最安値149円を割った時点で損切り。
・売りを157円のときに入れた場合、上記チャートは直近149円まで落ちたため、149円で利食い。逆行した場合は直近最高値158円を超えた時点で損切り。

※ただし必ずしも前回最高値、最安値まで行くとは限りません。程々のところで利食いをするのが賢明です。下記ポイント2の揉めている価格帯のポイントで決済するのが現実的です。
ポイント2 : 同じ価格帯で売り買いが激しいところ
利食いもしくは損切りポイントの目安として直近の価格帯で売りと買いが激しく入れ替わっているポイントで反転することがあります。 下記チャートの青い枠をご覧ください。GBP/JPYの日足、2022年1月のチャートです。3つ青で括った場所はいずれも買いと売りが激しく入れ替わっているところです。このポイントを起点に売りと買いの大きな流れが転換する傾向にあります。

・ここで上の図のチャートを例にすると、157円、153-154円、149-150円のあたりで激しい売りと買いの攻防戦があります。この各地点で決済をするという選択です。
・買いを150円のときに入れた場合、上記チャートは直近高値153-154円で揉めているため、153-154円まで上がったら利食い。逆行した場合は直近で揉めている価格帯の最安値149円を割った時点で損切り。
・売りを156円のときに入れた場合、上記チャートは直近安値153-154円で揉めているため、153-154円まで下がったら利食い。逆行した場合は直近で揉めている価格帯の最高値157円を超えた時点で損切り。
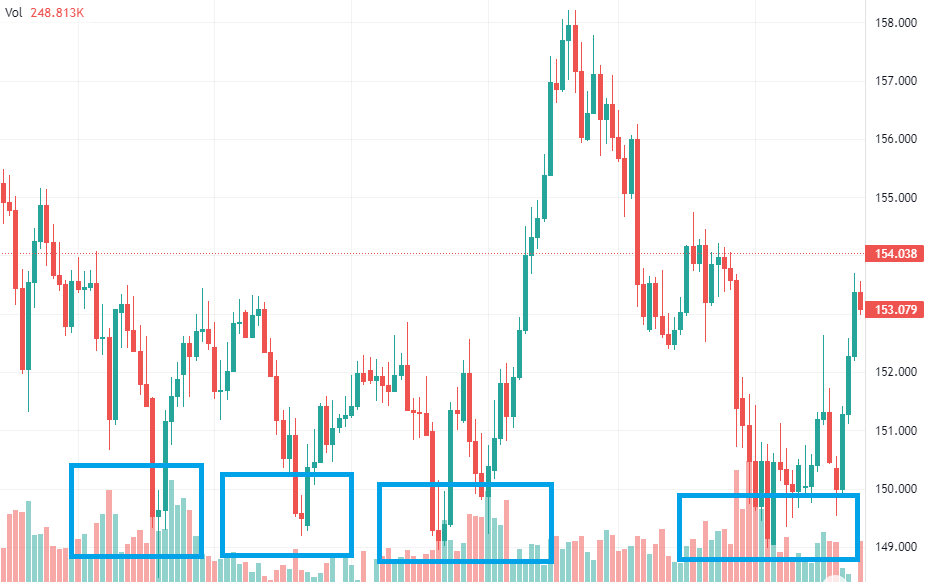
同じ価格帯で何度も反転しているところ
下記チャートは2021年のGBP/JPYの日足です。青い枠を見ればわかる通り、149円で必ず買い支えが起こり反発が起こっています。ここで必ず売りと買いが入れ替わっているため、強い抵抗線になります。ここで売り決済と買いエントリーをいれるというのも有効な戦術になります。逆に149円を割った場合しばらくは大暴落が起こります。


コメント