
2022年3月現在日本円の相場は日本円の大暴落が続いています。ほぼすべての通貨ペアで日本円売りが続いており、とても激しい暴騰相場になっています。10円近く上げそうな相場で、皆この上昇トレンドからの下降トレンド転換を狙っている人は多いのではないでしょうか。しかしこの暴騰相場で逆張り下降トレンドを狙うのはかなり勇気が必要です。外れれば大きな含み損になり大負けすることは確実だからです。そこで今回は上昇トレンドから下降トレンド転換する際の値動きの特徴について記事にしています。

売りの値動きの癖
買いとは違い、売りの場合は値動きに癖があります。大きな上昇トレンドから下降トレンドへの転換が起こる際は大きな落としが来るということが大きな特徴なのです。これは初心者の方でも見抜きやすいもので、すぐに判別がつきます。大きな値動きが数時間の間に起こるため、視覚的に判別しやすいのです。

ダマシ下げの場合
ダマシ下げの場合、陰線がとても短いことが特徴です。下記チャートはAUD/JPYの2022年3月上旬の1時間足です。赤色の陰線に注目ですが、どの陰線も短いこと、そして連続して陰線が来ていても下落幅が小さいことが特徴です。このような下落は、何時間続いたとしても下降トレンドへ転換することはありません。買い支えが強いことから下落幅が抑えられてしまい、トレンド転換はできないのです。
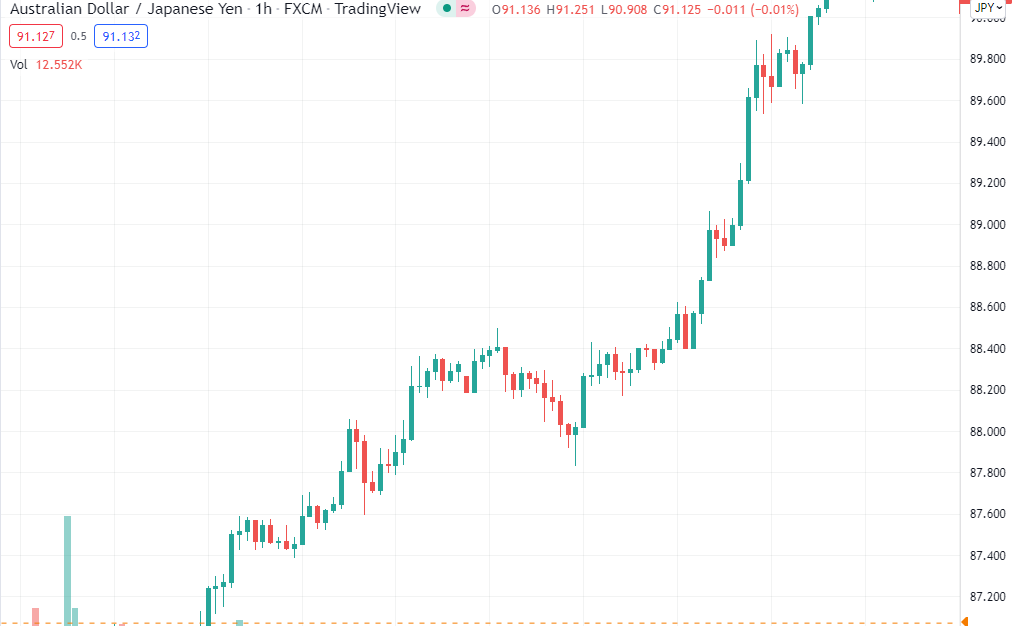
以上のように1時間足以上で見ても、短い下落で終わってしまう場合は100%下降トレンドは来ません。一時的な落としであり、本流はあくまで上昇トレンドなのです。
大きな下落が1本起こったとしても次のロウソク足であっという間に買い戻されてしまった場合はダマシ下げになります。大きな下落が連続したロウソク足で現れることが重要です。
下落トレンド
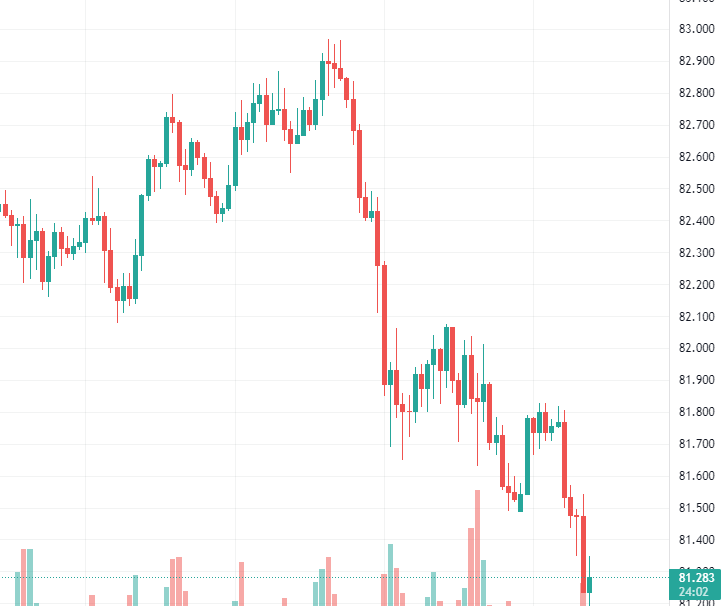
本当に上昇トレンドから下降トレンドへ転換した場合、長い陰線が連続して続きます。下記チャートはAUD/JPYの2022年2月の1時間足チャートです。長いひげが何本か出た後に長い陰線が連続して出ていることがわかります。これが本当の下降トレンドです。本当に下降トレンドが起こった場合は、数時間の間に100-150pipsは簡単に落としてきます。
売りの特徴
売りの場合は、大きな下落が数時間の間に一気呵成にやってきます。買いとは違い、売りの場合は勢いがあること、そして大きな下落が連続して起こるということが大きな特徴です。買いの場合と違い、わずか数時間の間に100pips以上落としてくるので、視覚的に見分けが付けやすいため、初心者の方でもとてもわかりやすいのです。


コメント