2022年3月はオーストラリアドルの一方的な買いが起こっています。アメリカドル、日本円、ユーロ、ポンド。どの通貨ペアで見てもオーストラリアドルの圧倒的優位が続いているのです。このような一方的な相場は後々で大きな大反発が起こる可能性を秘めています。ロシアのルーブルのように世界中から制裁を受けている通貨は例外ですが、それ以外の場合は一方的な値動きに対して反発する動きを必ず見せます。

反作用の法則
チャートは大きなトレンドが起こると、そのあと、大きく戻すという性質を持っていることを知っていますか?仮想通貨でも株でも起こるのですが、為替相場ではこの反発の法則が嵌りやすい傾向にあります。ただしロシアのルーブルのように世界中から制裁を受けている通貨は例外です。ロシアルーブルは世界から意図的に制裁を受けているため、反作用は働きません。しかしそれ以外のチャートでは必ずこの作用が働く傾向にあります。
2022年3月のオーストラリアドル
下記記事でも紹介したのですが、3月上旬はどの通貨ペアでもオーストラリアドルの一方的な買いが起こっています。このような相場に遭遇した場合、近い将来に大きな大反発が起こる可能性があります。そのため、トレンドフォローをして値幅を取れると思いますが、突然の反作用が生まれる可能性も秘めているのです。

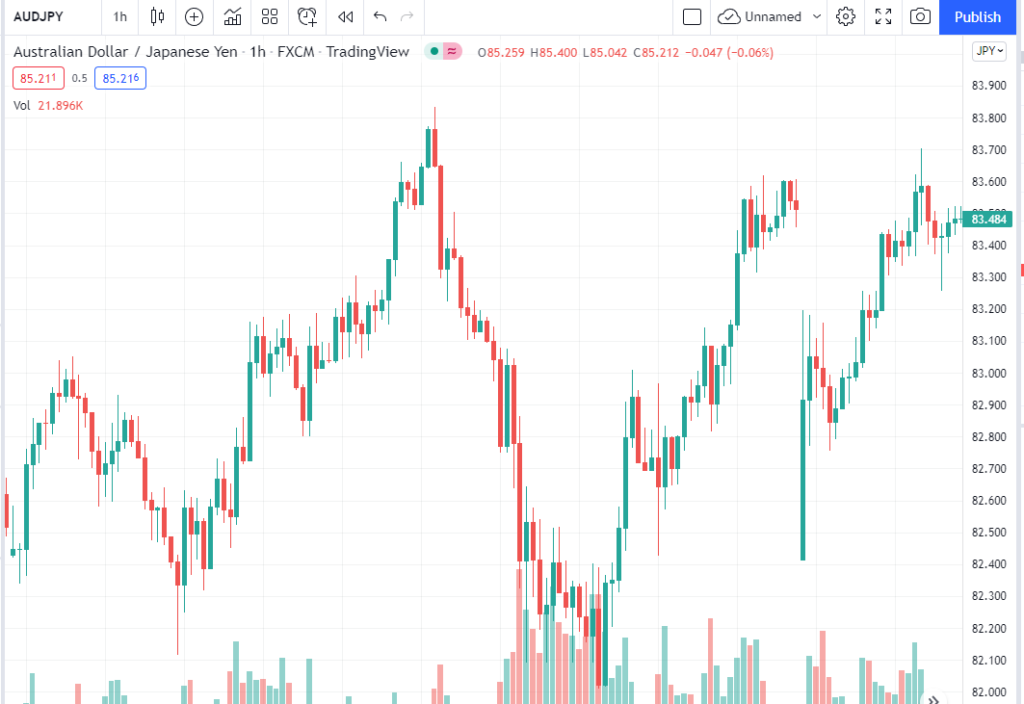
例1 : AUD/JPY
下記チャートは2022年2月下旬AUD/JPYの1時間足です。ロシアのウクライナ侵略が発表されることで相場は大暴落。83.8円から82.0円まで落ちました。それも大きな反発が起こらず落としてしまったため、その後チャートは大暴騰。82円から85円まで暴騰する結果となっています。このように大きな反発も起こらず、ひたすら一方的に動くチャートは、後々大きな大反発を呼ぶ傾向にあります。外国為替はこの傾向がとても顕著ですが、これは株や仮想通貨でも同じ傾向がみられます。このようなチャートの場合、V字回復どころか、それ以上の反発を起こす傾向にあります。
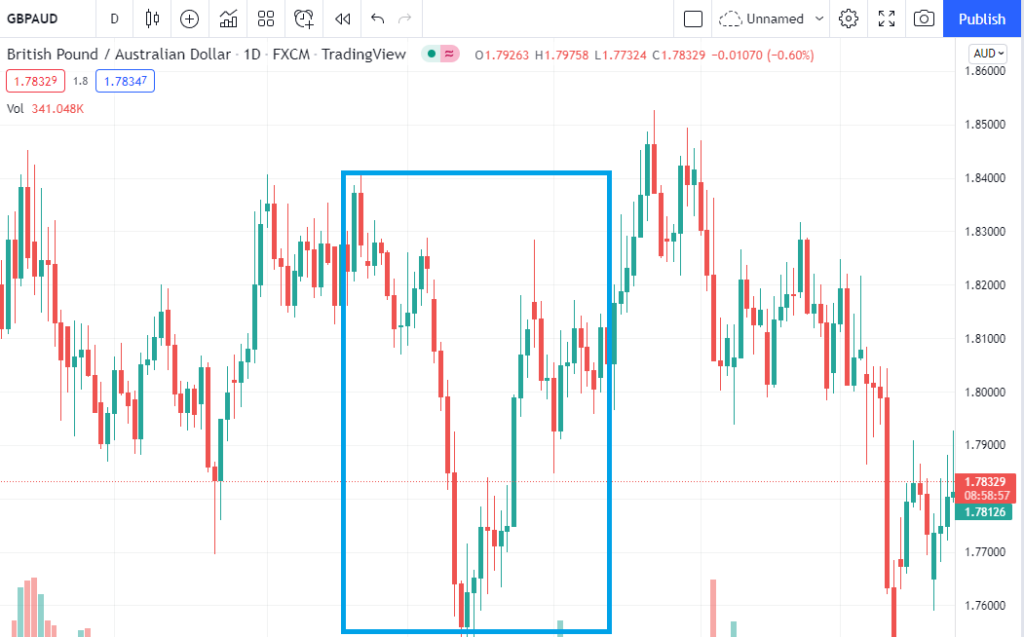
例2 : GBP/AUD
下記チャートは2021年10月のGBP/AUD日足です。青枠に注目ですが、大きな暴落が起こり、一方的に落としましたが、そのあと、大きな反発を呼び、大暴騰しています。ほぼ落とした分をすべて戻す結果となっています。このようなチャートの場合、V字回復どころか、それ以上の反発を起こす傾向にあります。
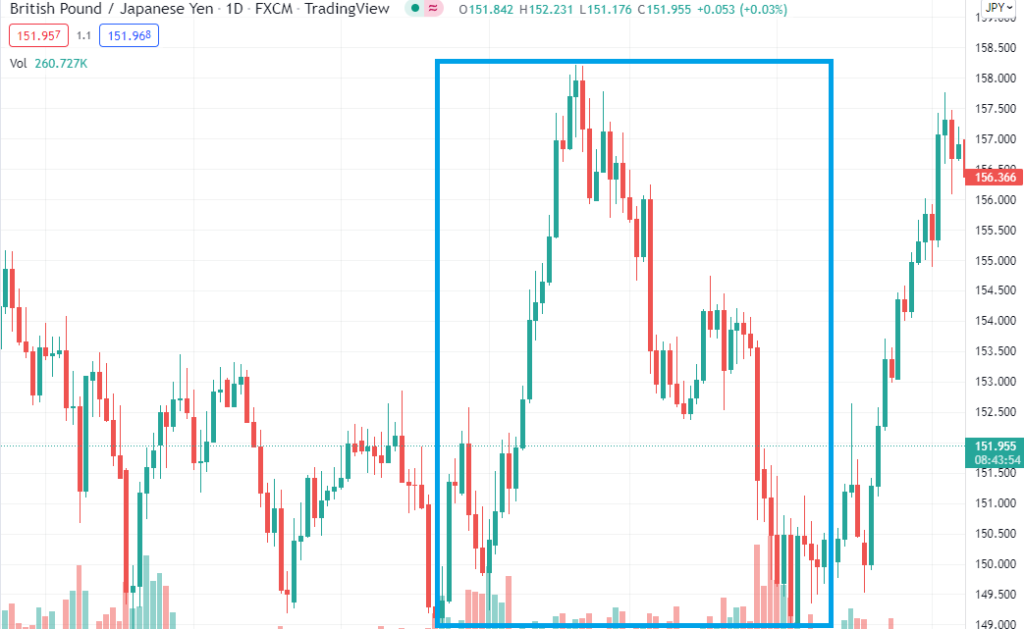
例3 : GBP/JPY
下記チャートは2021年10月から12月のGBP/JPY日足です。青枠に注目です。一気に10円近く上げた後、なんと全部戻しているのです。一気に上げ過ぎたことから、反作用が生まれ、一気に落としています。このようなチャートの場合、逆V字回復どころか、それ以上の反発を起こす可能性もあります。
緩やかなチャートは反作用が起こらない
突然大きく動くチャートはまるで呼び起こされたかのように大きな反作用を起こしてしまいますが、その一方で緩やかに徐々に上がったり、下がったりするチャートの場合は反作用が働かない傾向にあります。一見とても地味で面白くない値動きに見えてしまうのですが、実はゆっくり動くチャートほど、結果的に大きなトレンドになることが多いのです。


コメント