
移動平均線と標準偏差から成っており、移動平均線とその上下に値動きの幅を示す線を加えた指標になります。統計学を応用したテクニカル指標のひとつで株、仮想通貨、FXトレード系全てに使える優秀な指標になります。今日はこのボリンジャーバンドについて語っていきます。
±1σ = n日の移動平均 ± n日の標準偏差
±2σ = n日の移動平均 ± n日の標準偏差*2
±3σ = n日の移動平均 ± n日の標準偏差*3
標準偏差=√(n×n日間の終値の2乗の合計-n日間の終値の合計の2乗)÷(n×(n-1))
ボリンジャーバンドは±1~3の3種類あります。トレードでよく使うのは±2αになります。実際のチャートを使って見方を説明していきます。
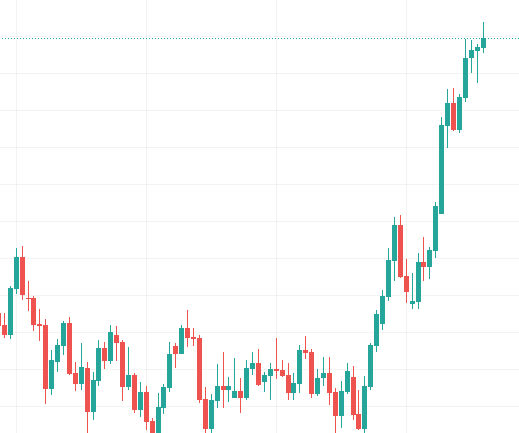
これがデフォルトのチャートになります。ここからボリンジャーバンドを追加してみましょう。
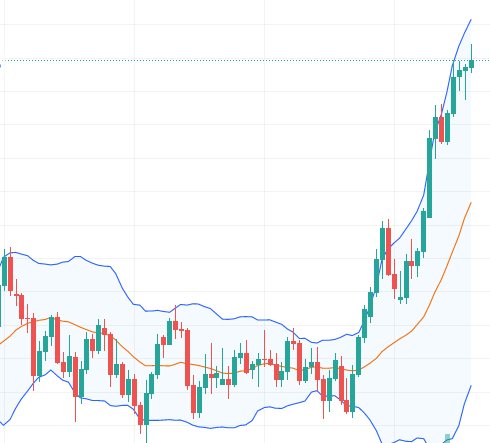
±2αの線が青色、橙色がミドルラインになります。チャートの95%は 2αの線 の枠内に収まると言われており、枠からはみ出したときにトレンドサインになると言われています。つまりこのボリンジャーバンドを使うことによってチャートの強弱がわかりやすくなるのです。これは株や仮想通貨でも同様にあるのでトレンドフォローをする人にとっては必需品でしょう。↑にはみ出ればアップトレンド、↓にはみ出ればダウントレンドになります。


コメント